
Cap in hand
Britain’s new £2,000 limit on salary-sacrificed pensions is aimed at the well-paid, and will mostly hit them. Person-level data suggest the revenue is safer than sceptics fear and smaller than the headline — and that the real gamble is with saving, not receipts.
In brief
- From April 2029, salary-sacrificed pension contributions above £2,000 a year lose their National Insurance exemption. The Office for Budget Responsibility expects £4.7bn in the first year, falling to £2.6bn a year thereafter; much of the first-year figure is a one-off timing effect. An independent imputation in this paper comes within a tenth of the static costing.[1]
- The burden falls narrowly: 70% of the affected saving belongs to the top tenth of earners, and the bottom half of the earnings distribution is barely touched. In person-level records the affected saver has a face: a man of about 40 earning £75,000, sacrificing 5% of his pay, while the typical below-cap user is younger, paid half as much, and more often a woman.
- Two tax streams run through this debate, and they behave differently. The NI the cap charges is permanent revenue: pension income never pays NI in any world. The income-tax stake the Treasury holds in every pot (£15 per £100 at market value for a basic-rate retiree, more where retirement income reaches the higher band) is lost only where the cap causes saving to die rather than change route. Keeping the two apart changes several popular conclusions.
- Follow the pound and the revenue looks resilient: money that leaves a pension resurfaces as taxed pay or taxed profit. Only one response erases revenue outright: employers rebalancing into ordinary employer pension contributions, which never attract NI. The OBR has partly priced it, at £0.7bn, and it sits with large, well-advised employers that no small-business dataset can observe. 70% of the affected saving sits where that door opens easiest. The genuine uncertainty is behavioural: the responses differ mainly in whether saving survives, and no national dataset can see which one savers take.
Analysis: person-level records of 10,538 workers at 965 small firms on the Husky workplace pensions and savings platform, February 2025. Method and sources at the end.
The policy
Salary exchange, or salary sacrifice, is a simple bargain. An employee gives up part of their salary; the employer pays the same amount into their pension instead. Because the exchanged money is never salary, no National Insurance is due on it — a saving of 8% for the employee (2% above the upper earnings limit) and 15% for the employer. Income tax is unaffected: pension contributions get relief on the way in and are taxed on the way out, whichever route they take.
The exemption was never an accident. National Insurance has, since Beveridge, been a levy on earnings in exchange for benefits, and employer pension contributions, deferred pay set aside for retirement, have always sat outside it. Nor did it survive by inattention: when the government shut down salary-sacrifice advantages for most perks in 2017 (company cars, phones, gym memberships), it deliberately spared pensions, alongside a handful of favoured perks such as cycle-to-work schemes, judging retirement saving worth keeping cheap.[9]
In the November 2025 Budget that judgement was reversed. From April 2029, only the first £2,000 a year of sacrificed contributions will remain NI-free; the rest will be charged to both parties. The OBR scores the measure at £4.7bn in 2029–30, one of the Budget’s largest revenue-raisers. The durable figure is smaller: receipts fall to £2.6bn in 2030–31, because much of the first year is a one-off timing effect as workers switch contribution arrangements.[1] HMRC reckons about 44% of the 7.5m employees who use salary sacrifice contribute above the new threshold.[2] What changed was not the argument for the exemption but the arithmetic of the public finances.
An unusual dataset
The official analysis rests on national survey data, which records who uses salary sacrifice and how much they contribute. This paper draws on something different: the client records of Husky, a workplace pensions and savings platform for small and mid-sized firms whose services include salary exchange — 10,538 workers at 965 companies as of February 2025, with each worker’s pay, pension contributions, sacrifice amounts and demographics linked to their employer. Among them are 3,483 workers at the 159 firms that offer salary exchange, of whom 1,162 use it (one further firm is excluded for a payroll fault; see the appendix).
The two sources tell a consistent story. Take-up sits in the same broad range: a third of workers where the scheme is offered, against roughly a quarter of employees nationally. Both show the steep earnings gradient the Institute for Fiscal Studies has documented,[4] and both find higher raw usage among men than women (32% against 23% nationally).[3] What the national data cannot see is the margin this cap will move: whether an employer offers the scheme at all, who declines it, and when each person joins or stops. This dataset answers the first two.[8]
Concretely, four things in this paper come from the Husky records; no national source provides them. The pound values: what salary exchange is actually worth per worker, and who captures it. The parameters: the NI rates and sacrifice amounts that drive the arithmetic of later sections are measured from real contributions, not assumed. The inside view: national statistics show where the cap’s burden sits across the earnings distribution; person-level records show how it lands within actual firms. And the small-firm ledger: reweighted to national firm demography, the records yield an estimate of the cap’s incidence in small-firm Britain that no national source offers. Together these let the analysis do what no national source can: put a face on the people the cap will actually touch.
What salary exchange is worth
Start with what is at stake for the saver. The median user in the Husky data gains £792 a year compared with making the same pension contribution without salary exchange; the average, pulled up by higher earners, is £1,746. Set against salary this is about 1% — modest. But salary is the wrong benchmark. The scheme operates on the pension contribution, and against that base the saving is roughly 20%. Every £1 a worker puts into their pot through salary exchange costs about 80p of what the same contribution would cost without it.
Employers do well too, saving 15% of every pound sacrificed — £1.06m a year across the 124 Husky firms with active users, of which about £0.6m is voluntarily passed back into workers’ pensions and £0.4m kept. The fiscal mirror image: HMRC forgoes about £1.25m a year on the £7.04m these workers sacrifice, £1,075 per user. Of that, £1.06m is employer NI and only £0.19m employee NI. The relief is mostly a subsidy to employers — which is exactly what the reform targets.
Who pays
Who bears the cap? The IFS has published the two numbers needed to answer at national scale, decile by decile: the share of employees sacrificing more than £2,000, and the average new NI per employee if nobody changes behaviour.[4]
|
Earnings decile |
Share sacrificing > £2,000 |
Above-cap saving (£bn/yr) |
New NI, no behaviour change (£bn/yr) |
|
1–5 (lower half) |
0–6% |
£0.4 |
£0.1 |
|
6–7 |
12–20% |
£1.5 |
£0.3 |
|
8 |
28% |
£2.1 |
£0.4 |
|
9 |
35% |
£3.5 |
£0.6 |
|
10 (highest) |
48% |
£16.9 |
£2.9 |
|
All (~29m employees) |
15% |
£24.3 |
£4.2 |
Sources: shares and per-employee NI by decile from IFS (O’Brien & Oulton, 2026), digitised from published charts [4]. £bn columns are authors’ calculations: 29m employees split evenly across deciles; above-cap saving = new NI divided by the NI rate on the excess (23% in deciles 1–7, 17% in deciles 8–10). The £4.2bn static total sits within about a tenth of the OBR’s £4.7bn first-year score: a cross-check, not a replication [1]. Rows use unrounded digitised values and do not recompute exactly from the displayed figures. The 15% share implies about 4.3m above-cap employees; HMRC’s 44% of 7.5m users implies 3.3m. This paper says ‘more than three million’.
The concentration is the story. Seventy percent of the affected saving belongs to the top decile alone (Exhibit 1); the lower half of earners is barely touched. In that narrow sense the cap is well aimed, as the IFS concluded. It also means the yield depends almost entirely on how the top decile responds: the group most likely to have advisers and alternatives.

Exhibit 1. Source: authors’ calculations from the table above.
Husky’s records show the same pattern from the inside. Among its salary-exchange users, 96% of those earning over £50,000 would be caught, against 4% of those under £30,000; the affected worker and employer together lose £947 a year on average (the median is about £365); and nearly four in five users are above the cap, against 44% nationally. Engaged scheme populations, in other words, are far more exposed than the national average suggests.
Person-level records can go a step further than deciles: they can say who these savers are.
|
Affected (above cap) |
User below the cap |
Non-user |
|
|
Workers |
897 |
265 |
2,321 |
|
Median age |
41 |
34 |
35 |
|
Male |
61% |
39% |
52% |
|
Median pay |
£75,000 |
£34,300 |
£48,000 |
|
Median tenure |
3.5 yrs |
2.4 yrs |
1.9 yrs |
|
Median sacrifice |
£4,000 (about 5% of pay) |
£1,400 |
— |
|
Uses the provider’s app |
89% |
85% |
42% |
Source: authors’ calculations from the Husky records [8]; workers at SE-offering firms. Pay annualised; sectors: 64% of affected savers work in IT, professional services or finance.
Two things stand out from the profile. The affected saver is the scheme’s best customer — mid-career, long-tenured for a small firm, saving seriously at 5% of a £75,000 salary, and almost always on the app. And the cap does not merely split the earnings distribution; it splits the scheme’s users into two different people. The typical below-cap user, younger, paid less than half as much and more often a woman, keeps the full exemption. The man of 41 who built a 5%-of-pay habit loses most of his. Whatever one thinks of that trade, no national dataset can see it; this one can.
A third feature follows from the first two. In firms this size, the person who decides how the scheme responds to the cap is rarely a disinterested administrator: the owner or director who chooses is likelier than anyone else on the payroll to fit the affected profile. The responses the rest of this paper traces will therefore be chosen, in large part, by people paying the new charge themselves. That cuts both ways. The affected are the best placed to arrange the efficient split; they are also the ones with a fresh personal reason to cool on workplace pensions altogether. A static costing assumes the decision-maker is unmoved. Here, the decision-maker is the taxed.
That bill lands first on the employer’s payroll ledger: £15 of the £17.30 collected per £100 is employer NI. If nothing changed, 118 of the 159 SE-offering firms in the Husky data would face a new employer-NI cost — a median of about £2,600 a year, a quarter of the bills above £7,400, the largest near £70,000. Set against wage bills these are small numbers: typically a quarter of one per cent. But for one affected firm in eight the bill exceeds 1% of payroll. And for the typical firm it claws back more than half of the £4,800 a year that salary exchange currently saves it.[8]
Does a bill that size ripple outward, into hiring and prices? The channels are real: employer payroll costs settle, in some mix, on pay growth, prices, hiring and margins, and Britain watched all four operate after the April 2025 NI rise.[4] But proportion matters. The employer share of the cap comes to roughly £3.7bn a year nationally (the employer slice of the £4.2bn static base): about 0.3% of the national wage bill, and around a seventh of the 2025 rise, which touched every employer in the country. This is a firm-level cost, not a macroeconomic shock. The incidence assumption in the costing points inside the firm, though: the OBR, like most analyses of employer NI, assumes the charge is passed on over time, mostly through slower pay growth. Applied illustratively at firm level, with each bill-facing firm spreading its annual bill across all staff, the median across the 118 such firms here comes to about £177 per employee a year (a quarter of those firms sit above £379); 70% of the 2,964 workers at those firms are not above-cap savers, yet on that assumption they help pay. The sharper point is who it lands on: only firms that operate salary-exchange schemes pay anything at all, while employers that never lifted a finger for retirement saving pay nothing — a charge aimed, with some precision, at the businesses that did what pension policy asks. For the firm in eight where the bill tops 1% of payroll, the squeeze is familiar: still digesting the 2025 rise and successive minimum-wage increases, too small to renegotiate every contract. One more cost is one more reason to take the cheap exit, where saving quietly dies.
Small-firm Britain
National totals hide a decomposition nobody has published: how much of the cap lands in small firms. The Husky records make an estimate possible. Reweight the person-level sacrifice distributions to national firm demography (private-sector employment by size band and industry, from the Business Population Estimates) and the one number missing is the share of small-firm employees who use salary sacrifice at all. No national source measures it by firm size; HMRC’s economy-wide figure is about 26% and small-firm usage is almost certainly lower. The estimate is therefore a range, linear in that rate.[15]
|
Small-firm salary-sacrifice usage |
Affected savers |
New NI, static (£bn/yr) |
Share of the £4.2bn |
|
5% |
≈ 280,000 |
£0.3 |
6% |
|
13% (central: half the national rate) |
≈ 740,000 |
£0.7 |
16% |
|
26% (the national average) |
≈ 1.5m |
£1.4 |
32% |
Source: authors’ calculations (note [15]); private-sector firms with 1–49 employees, 8.2m workers. The estimate is linear in the usage rate: each percentage point adds about 57,000 affected savers and £0.05bn. Percentages of the £4.2bn use unrounded values and do not recompute exactly from the displayed cells.
The range is wide, and its ends agree on one thing. At half the national usage rate, roughly 740,000 affected savers work at private-sector firms with fewer than fifty staff, and the sector supplies about £0.7bn of the £4.2bn static yield: a sixth of the money from a third of private-sector employment. Even at full national usage the share reaches only a third; the cap’s money is at large employers. This is a small-firm estimate, not a representative one: platform selection survives the reweighting — platform users sacrifice about a fifth more than the national figures imply, an upward tilt in the pound numbers — and note [15] sizes it. What concentrates in small firms is not revenue but fragility: the one response that rebuilds the exemption in full (replacing salary sacrifice with ordinary NIC-free employer contributions; see ‘Four doors’ below) comes easily to the large and well-advised, and barely at all to a busy owner-manager. Small-firm Britain supplies a minority of the cap’s receipts and holds a disproportionate share of the saving most likely to die quietly.
The Treasury’s silent stake
The £4.7bn counts the NI the Treasury will start collecting. It leaves out what the Treasury already stands to collect from the same savers later. Britain taxes pensions on the way out: contributions go in untaxed, but withdrawals are taxed as income, with a quarter tax-free. That makes the Treasury a silent partner in every pension pot in the country, holding, for a typical basic-rate retiree, a stake of roughly 15%: 20% tax on 75% of whatever the pot becomes.
Two clarifications keep the arithmetic honest. The stake is income tax, not National Insurance: pension income never pays NI, so NI the cap collects or forgoes is permanent in every scenario. And the stake exists in the no-cap world too: it enters the ledger only on the margin where the cap causes saving to be consumed rather than saved. Where saving merely changes route, the stake is untouched; where saving dies, it dies with it. The door-by-door accounting below applies it exactly there, and nowhere else.
How much is that stake worth today? Two answers. The market answer is the disciplined one: a claim on 15% of a pot is worth 15% of what the pot is worth today, £15 per £100, whatever its expected return. Expected outperformance over gilts is not free money; it is compensation for risk the Treasury bears alongside the saver. A more generous answer credits the state with deep pockets and a long horizon and discounts at the gilt rate, which values the claim at £19–30 per £100 when pots beat gilts by 1–3% over a working life. Which answer is right is a live debate in public finance; this paper uses the market answer as its base case and shows the generous one only as a sensitivity. The market answer has a refinement of its own: because the exit tax is progressive, £15 is a floor for the savers the cap touches. Priced as an option on the pot, the claim on the marginal £100 runs £15–£30 across savers in a two-band model and roughly £20–25 for the typical affected saver (Appendix B). The ledger below uses the floor and notes where the priced value would change it.[6]
|
Valuation of the Treasury’s claim, per £100 kept in a pot |
|
|
Market value (base case, any horizon) |
£15.0 |
|
Option-priced, progressive exit tax, typical affected saver (Appendix B) |
£20–25 |
|
Gilt-discounted, pots beat gilts by 1% (25 yrs) — contested |
£19.0 |
|
Gilt-discounted, 2% (25 yrs) — contested |
£24.1 |
|
Gilt-discounted, 3% (25 yrs) — contested |
£30.4 |
Source: authors’ calculations; 15% is the effective exit-tax rate for a basic-rate retiree [5]. Valuation approaches and the debate between them in note [6].
For scale, the NI at issue on that same £100 of sacrificed saving is £17–18 in the Husky data. The two numbers meet only on the displacement margin: where the cap causes pension saving to die, the Treasury forgoes the cap’s NI on that saving and loses a £15 asset; what replaces them depends on the door, since pay brings income tax and NI of its own and employer capture brings profit tax. Where saving survives, by whatever route, the stake is unaffected and the NI arithmetic stands alone.
Neither valuation should obscure that the claim pays in real money. £100 kept in a pot today is expected to hand a future Chancellor £50–80 of actual receipts at drawdown (15% of a pot that has compounded at 5–7% for twenty-five years), cash that will score as ordinary revenue in the Budgets of the 2050s. Market value answers what that stream is worth today, given its risk; the flow is what the fiscal ledger will eventually record. Both are true at once, and the distinction matters for what follows: the five-year ruler sees neither.
Why would the Treasury ignore an asset it owns? Because its ruler cannot see it. The fiscal rules the government is judged against run over the OBR’s five-year forecast: in practice over the lifetime of a parliament, and often over the headroom in a single fiscal year. A claim that pays out in twenty-five years does not exist on that ruler, however large its present value today. The scoring is not careless; it is the accounting horizon doing exactly what it was designed to do. The trouble is that pensions are the longest-dated contract in public finance, and a five-year ruler laid against a thirty-year asset will systematically prefer collecting once to compounding.[10]
Four doors
What happens from April 2029 depends on a decision that more than three million savers, and their employers, will each make. For the amount above £2,000, a worker has two options of their own, and the employer controls two more. The discipline is to follow the pound through each of them.
Keep saving. Carry on putting the same amount into the pension, through salary exchange (now paying NI on the excess) or an ordinary contribution, which amounts to the same thing. The pot keeps growing; the Treasury collects the new NI now and keeps its stake for later. This is the outcome the official costing assumes.
Take it as pay. Cut the pension saving and have the money as salary. The Treasury does best of all today (income tax and both NI charges arrive at once) and the worker retires with less. The much-discussed ‘quiet stop’ usually ends here too: when an existing sacrifice lapses, the salary it was carved from comes back, and comes back taxable. Money that leaves a pension does not leave the tax system. (The figures below assume, as the OBR does, that the employer’s NI comes out of the pay package: £100 of sacrifice funds about £87 of gross pay once the employer’s charge is met. If employers instead grossed pay up in full, the Treasury would collect £57 rather than £50.)
Let the employer rebalance. A firm can raise ordinary contractual employer pension contributions and reduce pay to match. Ordinary employer contributions remain entirely NIC-free, untouched by the cap, so this door quietly rebuilds the old bargain. It is not free to open: contracts must be renegotiated, and the remuneration rules prevent aiming it only at affected staff. The OBR expects enough of it to cost £0.7bn of revenue in 2030–31 alone.[1]
Let the employer keep it. The scheme ends and pay stays where it was: the sacrificed amount becomes employer margin, taxed as profit: corporation tax now, more if it is ever distributed. The Treasury still collects; the worker loses twice, with pay unchanged and the pension smaller. In the small-company world this data describes, where nobody may propose the pay rise, this door is likelier than polite analysis assumes.
Is there a best answer? For retirement money, yes, and it is unglamorous: keep saving. The cap removes the NI advantage but leaves the income-tax advantage intact. A higher-rate saver above the upper earnings limit who keeps £1 flowing into the pension now gives up about 60p of take-home pay (58p of pay forgone plus the new 2% NI charge) for £1 growing tax-free, taxed at about 15% on the way out. Taking it as pay delivers 58p today and nothing more. The rational strategy is a split: sacrifice the first £2,000, which stays NI-free, and continue the rest by whatever route is convenient. Taking money as pay is a liquidity decision, not a tax one. That is the best a worker can do alone; the best joint answer belongs to the employer, whose rebalancing door rebuilds the NI exemption in full. Expect the large and well-advised to find it, and the small and busy to miss it.
It also matters who decides. Higher-paid employees at large firms will be walked through exactly that split by an adviser. In the small-company world Husky serves, the employer’s scheme decision often becomes the worker’s outcome by default. Per £100 of above-cap saving, the four doors lead to very different places for the Treasury:
|
Where the pound goes |
Treasury collects now |
Future claim |
Net effect (market-value claim) |
|
Kept in the pension, NI paid — the scored outcome |
+£17.30 |
kept |
+£17.30 |
|
Taken as pay (higher-rate saver, employer-cost-neutral) |
≈ +£50 |
lost |
≈ +£35 |
|
Captured by the employer (taxed as profit) |
+£25 |
lost |
+£10 |
|
Rebalanced into ordinary employer contributions |
£0 |
kept |
£0 |
Source: authors’ calculations, with the future claim valued at market (£15 per £100; note [6]). Net effect compares each path with the no-cap world. ‘Kept’: 17.3% is the average employee-plus-employer NI rate on above-cap contributions in the Husky data [8]; the claim is unchanged, so the net effect equals the cash collected. ‘Taken as pay’: employer-cost-neutral — £100 of sacrifice funds £87 of gross pay plus the employer’s 15% NI; the pay bears 40% income tax and 2% employee NI, so about £50 is collected, minus the £15 claim given up. Grossed-up pay would yield £57 (net +£42). ‘Captured’: corporation tax at 25% on the retained amount (further tax if distributed), minus the claim; at the option-priced claim of £20–25 (Appendix B) this door’s net falls to roughly nil. ‘Rebalanced’: ordinary employer contributions attract no NICs and the claim is unchanged — fiscally identical to the no-cap world.
Note the pattern. Followed to its destination, the pound is taxed behind every door but one: the employer-rebalancing door, which is also the response the OBR has partly priced. On the worker’s side, the cap’s revenue is therefore more resilient than early sceptics have suggested. What the doors really decide is whether saving survives: it does where the money stays in a pension — kept, or rebalanced into ordinary employer contributions — and dies where it becomes pay or margin. That reframing matters, because it moves the argument from receipts, where the data mostly reassure, to retirement saving, where they do not. One caveat runs the other way: at Appendix B’s £20–25 valuation of the claim, the employer-capture door nets the Treasury little or nothing in present value, depending on the firm’s corporation-tax position; a near-second door that raises no revenue, and the one likeliest in small firms.
Scenarios for Britain
Exhibit 2 follows the pound through each door. Money that leaves a pension does not leave the tax system: taken as pay it meets income tax and both NI charges at once; captured by an employer it becomes taxable profit. At the £15 floor used here, only one door yields the Treasury nothing from the cap.

Exhibit 2. Source: authors’ calculations, per £100 of above-cap saving, net of the Treasury’s claim on the pot at market value (£15 per £100); derivations under the table in ‘Four doors’.
|
If all above-cap saving went through one door… |
Net to the Treasury, per year |
|
Kept in the pension (the static score) |
+£4.2bn |
|
Taken as pay |
+£8.4bn |
|
Captured by employers |
+£2.4bn |
|
Rebalanced into ordinary contributions |
£0 |
Source: authors’ calculations on the £24.3bn national base from ‘Who pays’. Illustrative bounds, not forecasts: no door will be taken by everyone. At Appendix B’s option-priced valuation the employer-capture row falls to about £0–1bn.
Two conclusions follow, each with a boundary. First, on the worker’s side the revenue is resilient: most exits from pension saving resurface somewhere taxable, and the broad evidence on retirement saving finds the great majority of savers passive even in the face of large price changes.[12] That evidence comes with a bifurcation the debate should respect. The passive majority is a low- and middle-income majority. High earners, who hold 70% of the affected saving, include the active minority who do respond, as Britain learned when senior doctors cut their hours rather than pay the annual-allowance taper.[14]
The durable £2.6bn is therefore credible on the worker side, in cash. The open fiscal question sits with employers. Rebalancing into ordinary NIC-free contributions is the one door that erases revenue. It opens most easily in the large, well-advised firms where the top decile works, and it is invisible from a small-business dataset like this one; the OBR’s £0.7bn allowance for it is an assumption, not a measurement.[1] Put this paper’s two central findings together and the stakes are plain: 70% of the affected saving sits exactly where that door opens most easily. Price the Treasury’s claim as an option rather than a flat 15% (Appendix B) and the gamble with revenue, measured in present value, widens: employer capture, the door most accessible to small firms, then nets little or nothing. Second, because money is taxed wherever it goes, the doors differ mainly in what happens to saving: it survives where the money stays in a pension (kept or rebalanced) and dies where it becomes pay or margin, though a slice of what is taken as pay may resurface as ISA saving, outside the pension system. The cap is a modest gamble with revenue and a larger one with retirement saving — and which door savers take is a question no national dataset can answer.
Spending in disguise?
Readers will meet two framings of this debate. The official one treats a relief as government spending in disguise: money the Treasury could have had, and therefore a £4.7bn cost to be recovered. It is a view with a long pedigree in tax policy.
The older view runs the other way: the money was never the Treasury’s. The relief leaves resources where they started, in pension pots and on company balance sheets, flowing into long-term investment rather than being collected, administered and redistributed, with something lost at each step. On this view the state’s true cost is what it spends, not what it declines to collect; and since pension pots are taxed on the way out after decades of growth, much of the ‘forgone’ revenue is merely deferred at a profitable rate of interest. One honest caveat belongs to the other side: subsidising saving is not automatically a social gain in every economic climate.[7]
The IFS reads the same reform through a third lens: design coherence. On its account the cap fixes one arbitrary boundary, between salary sacrifice and employee contributions, while sharpening another, between salary sacrifice and ordinary employer contributions, and adds complexity for employers and HMRC alike. The deeper issue, it argues, is the NICs exemption on employer pension contributions itself, worth £25.9bn in 2023–24, which it would replace with a smaller uniform subsidy open to the self-employed. The diagnoses differ (the IFS sees an oversized, incoherent relief; this paper a fairly priced deferral), but the two arrive at the same verdict on the measure at hand: the cap raises uncertain money without fixing the system it complicates.[4]
This paper does not need to pick a side. On any of these framings the useful facts are the same: who bears the cap, what it does to saving, and what the Treasury’s deferred stake is worth. Those are measurable, and this paper has measured them.
Moving the goalposts
Rule changes land hardest on plans already made. A pension is a forty-year contract in which one party, the state, can rewrite the terms at any Budget. For a 30-year-old, the cap is a price change, with decades to adjust around it. For a worker of 58 who built a retirement plan on rules the government examined and reaffirmed as recently as 2017, it is a levy on decisions that cannot be unmade. The adjustment horizon is the difference. In the Husky data, one in five affected savers is 50 or older, facing a median loss of about £425 a year on sacrifices already running at £4,400 a year, and with the fewest years left to adjust. Nor is the charge a one-off: the median affected over-50 is 54 in the records and will be about 58 when the cap starts, with nine years to state-pension age; kept up over those years the levy amounts to roughly £3,100 in today’s money for worker and employer together, discounted at gilt rates.
Whether such losses deserve transition relief is a genuinely open question in economics. The classic analysis argues against grandfathering: policy change is a risk savers can anticipate and price like any other, and shielding incumbents distorts behaviour while shifting the burden to everyone else. Others weigh reliance on long-lived rules more heavily and are more permissive of relief.[11] Britain’s own practice has leaned permissive where accrued rights were at stake: each cut to the Lifetime Allowance came with formal HMRC protection for those who had saved under the old rules. The IFS draws the sharper distinction: those protections shielded a stock of pension wealth already built, whereas the cap changes only the NI treatment of future contribution flows, so the usual rationale for grandfathering does not arise, whatever the saver’s age. On that reading the 2029 cap comes with no protection because none is owed. What the age gradient in this paper’s data measures is therefore not an entitlement disturbed but a horizon shortened: fewer years in which to re-route future saving.[14] The nearest measured evidence comes from America, where workers would forgo around 6% of their social-security benefits merely for certainty about the rules. That evidence concerns state benefits, so it transfers only loosely here. But it suggests policy risk carries a real price even in years when nothing changes.[11] This paper takes no side on compensation. The data cannot settle whether the losers deserve relief; it can only show precisely who they are — and it does.
The right yardstick
The habit in this market, and in this paper so far, is to measure participation: who uses salary exchange and who does not. It is the wrong yardstick. For each worker there is a simple benchmark: route whatever they already save through the cheapest door. It demands no extra saving, no lost liquidity, no change of preference — only that the same pension contribution travel the route that pays less tax. This is not an optimum in any grand sense; it is the absence of a mistake. For some the benchmark is zero: sacrifice may not take pay below the National Minimum Wage, so a minimum-wage cleaner or nursery assistant who shows up as a non-participant is not lapsed or unengaged; they are at their benchmark. From 2029 the cap adds a kink of its own: the benchmark becomes sacrifice to £2,000, then contribute the rest by any route.
The better question is how far each worker sits from their own benchmark, in pounds a year. On that yardstick the picture changes. About half of the workers at salary-exchange-offering firms (50%) are already at or near it: the 1,162 users; 415 who make no pension contribution at all, so their benchmark is zero whatever one thinks of their saving; and about 150 savers whose pay leaves no legal headroom to sacrifice. The other half — some 1,750 workers — are genuinely short of the benchmark, by a median of about £500 a year each. Half of them earn £52,000 a year or more, so the wage floor excuses almost none of them. None of this should surprise: the best evidence on retirement saving finds the great majority of savers passive even in the face of large changes in the price of saving.[12]
Distance from the benchmark is the metric worth tracking as 2029 approaches: for providers, a truer measure of engagement than participation; for policymakers, a cleaner test of whether the cap pushes savers away from the cheap route or merely re-prices it.
What to watch
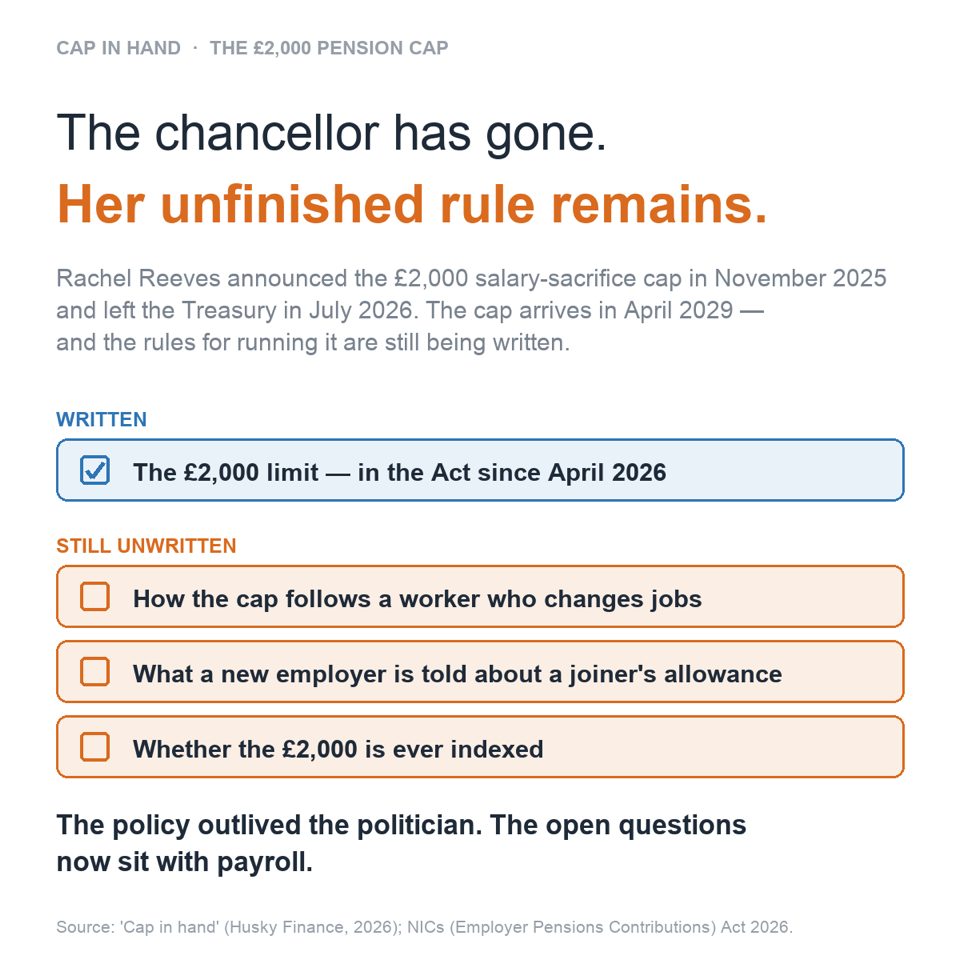
Three things follow. First, anticipation effects are already testable: above-cap savers have had roughly £950 a year each at stake on average since November 2025, ample motive to act years before 2029. Second, the below-cap market becomes the growth market. Sacrificing the first £2,000 stays NI-free indefinitely, worth £340–£460 a year per participating worker. The rational response to the cap is a split: sacrifice to the cap, contribute the rest by ordinary means. The calculation is simple; the payroll infrastructure is not. The Act sets the limit at £2,000 for a tax year and leaves the operating mechanics to regulations still to be written. If the threshold follows the person rather than the employment, a new employer must know how much of a mid-year joiner’s £2,000 is already used — information the standard new-starter process does not carry, and which would take changes to payroll software and to what HMRC shares with it. Third, the design margins deserve debate before 2029: whether the cap is indexed, how it treats employer pass-through, how the annual limit is tracked when workers change jobs, and whether lower earners might be exempted outright; on these data the under-£30k segment holds about 2% of the above-cap base.
Two internal tensions belong in that debate. The first is the investment channel, an effect the tax ledger cannot see at all. Pension pots are one of the few pools of patient domestic capital, and the government has spent two years persuading them to hold more of Britain. Under the Mansion House Accord, seventeen of the largest workplace providers, holding £252bn of assets, have pledged a tenth of their default funds to private markets by 2030, at least half of that in the UK.[13] Saving the cap displaces from pensions is subtracted from exactly that pool. Wherever it re-emerges (deposits, ISAs, consumption) it is less patient, less pooled, and under no such pledge. The effect resists precise sizing, since capital is fungible and much of any pot invests abroad; but a policy cannot recruit pension funds as investors in Britain while squeezing their inflows. The second tension is the backstop: every pound of private retirement saving discouraged today raises the future cost of the state’s own commitments, from means-tested support to the triple lock. The cap tightens both constraints at once.
A final observation from the data. App users in the Husky records adopt salary exchange at 51% against 9% for non-users: a hint that engagement, not arithmetic, decides who saves. The cap is about to test that proposition on a national scale.
Appendix A: method and caveats
- Data: Husky platform extract, February 2025; analysis restricted to active workers at companies offering salary exchange; duplicates and demo accounts removed. All figures computed from person-level records; no personal data appears in this paper. NI and minimum-wage rules are those of 2025/26, applied to the February 2025 contributions. Pay statistics are medians throughout: the recorded pay distribution is heavily right-skewed and extreme monthly values were adjudicated with the provider: most are genuine bonus or terminal payments, and one client (48 workers) is excluded throughout, its payroll feed having supplied annual salaries in the monthly pay field from January 2025. Correcting that client twelvefold instead of excluding it leaves every stated figure unchanged at the quoted precision. Headline book counts (10,538 workers, 965 firms) are pre-exclusion; the salary-exchange analytic sample is 3,483 workers at 159 firms.
- Sacrificed amounts are recovered from the employer-NI identity in the extract; 1,144 of 1,162 users have a measurable sacrifice. Worker benefit figures for users are the platform’s own per-worker calculations; non-user potentials apply 2025/26 NI rules to existing gross contributions.
- The app–adoption relationship is an association; the data cannot establish direction.
- This is one provider’s small-business client base: levels may differ elsewhere, though aggregate patterns match HMRC and IFS evidence. The cap simulation is static — it assumes today’s contributions.
- The benchmark calculation: each worker’s benchmark sacrifice is the lesser of their current gross pension contribution and their pay headroom above the National Minimum Wage (full-time floor, ~£1,984 a month at £12.21/hour); distance from the benchmark is valued at the worker’s NI-plus-relief rate. Without hours data, the floor treats low monthly pay as blocked, which is conservative.
- The £2,000 threshold is set in cash terms for 2029–30 and is not indexed; wage growth between this extract (February 2025) and 2029 will push more savers above it, so the affected shares quoted here are, if anything, conservative.
- The taken-as-pay arithmetic is shown employer-cost-neutral, matching the OBR’s incidence assumption; one-for-one gross conversion would raise the yield from about £50 to £57 per £100. Neither choice changes the ranking of the doors.
- Per-worker figures in this paper are gross new NICs (worker plus employer). The IFS’s household figures — an average £540 a year among affected households, £888 in the top income decile — are net of the income-tax and NI offsets that arise when pay falls, and are equivalised; the two sets of numbers are consistent, not competing.
Appendix B: the Treasury’s stake, priced as an option
The market answer in the main text values the Treasury’s claim at £15 per £100 kept in a pot: a proportional stake in 15% of a risky portfolio is worth 15% of its current value, whatever the portfolio’s expected return. That valuation needs no view on returns, risk or discount rates. It does, however, assume a basic-rate retiree. This appendix relaxes that assumption and shows that, for the savers the cap touches, £15 is a floor.
The claim is convex. Pension withdrawals are taxed as income: 20% in the basic band and 40% above the higher-rate threshold. Assume the state pension fills the personal allowance, a quarter of the pot is taken as the tax-free lump sum, and the remainder is drawn at a steady rate a (an annuity, or an equivalent drawdown). Annual taxable income is 0.75aS, so annual tax is 0.15aS + 0.15a·max(S − K, 0) with K = H/(0.75a), where H is the saver’s higher-rate headroom above the state pension; treating a as an annuity-equivalent conversion rate and capitalising by 1/a gives the claim on the pot: Tax(S) = 0.15·S + 0.15·max(S − K, 0). The Treasury holds a 15% linear stake plus a call option on the pot, struck where retirement income crosses into the higher band. Approximating the retirement pot as lognormal, the value of the claim on a marginal £100 kept in a pension is the call’s delta scaled by the 15-point notional: £15 + £15·N(d₁), where d₁ = [ln(F/K) + σ²T/2]/σ√T, F is the pot projected at the gilt rate and σ√T the cumulative volatility to retirement (Black’s formula on forward moneyness; the option’s level value is the familiar F·N(d₁) − K·N(d₂), discounted). Nothing in it requires an assumption about expected outperformance; the risk-free curve enters only through F, and the discount factor cancels in a value expressed per £100 invested today. The risk adjustment that makes gilt discounting contentious is done by the pricing, not assumed.
Illustration. For the median affected saver in the Husky records (41, earning £75,000, contributing to a state-pension age of 68) the marginal claim comes to roughly £20 per £100 (£17–20 across the volatility range) if income-tax thresholds are indexed from 2028, as the OBR’s baseline assumes, and roughly £25 if they were to stay frozen throughout, against the £15 floor and, in the two-band model, a £30 ceiling where the higher band is certain (Exhibit B1; assumptions in note [B1]). The frozen case is an upper illustration, not a forecast. The volatility input (8–12% a year over 27 years, spanning a default fund’s glidepath) matters little at the frozen marker, where the curves cross, and about £3 at the indexed one. The binding assumption is threshold indexation, a parameter the Treasury itself controls, and one whose freezing fattens the very claim the cap puts at risk.

Exhibit B1. Source: authors’ calculations; assumptions in note [B1]. Markers are the median affected saver under indexed and frozen thresholds; the two curves span the volatility range.
Consequences for the four doors. The cap collects £17.30 of NI per £100 of above-cap saving that survives. At £20–25, the claim destroyed where saving dies exceeds that gain. The sharpest change is at the employer-capture door: the profit tax collected (£25 at the main corporation-tax rate, £19 at the small-profits rate that may apply to many small firms, 26.5% in the marginal band between) against a £20–25 claim destroyed leaves a company-level net of about −£6 to +£6.5 per £100 before any distribution taxes: £0–5 at the main rate, hence roughly nil. Counted on this present-value basis, one door raises no revenue and employer capture may raise little or none, depending on the corporation-tax position; they are the two doors most accessible in the small-firm world this paper describes. The main text’s ledger, which uses the £15 floor, is therefore conservative: the paper’s verdict on revenue holds at the floor and weakens above it.
Why the main text keeps the floor. Three considerations pull back toward £15, and one pushes away. Savers hold the drawdown-timing option against the Treasury: withdrawals can be smoothed to stay within the basic band, and that option belongs to the taxed, not the taxer; from April 2027, however, unused pots fall within inheritance tax, which narrows, without removing, the room to avoid the call by leaving money untouched, and only for estates within its scope. The £20–25 figure is an annuity-equivalent benchmark before withdrawal timing is modelled. Default funds derisk along a glidepath, which lowers the option’s level value but moves the marginal delta both ways: down for savers below the threshold, up for those already above it. The calculation ignores the 45% additional rate, which would raise the claim further. The honest statement is that £15 rests on the fewest assumptions while the premium above it is real but contestable; the paper accordingly keeps £15 as its base case and reports the priced value alongside it.
One dynamic deserves a line. The valuation is static. Sustained displacement shrinks pots and, under a progressive exit tax, the average rate with them: the first pound displaced is the dearest. Threshold freezing works the other way, lowering the real strike each year. Which dominates is a race between two parameters, the £2,000 cap and the income-tax thresholds, whose interaction appears in no official scoring.
Notes and sources
[1] Office for Budget Responsibility, Economic and Fiscal Outlook, November 2025, and supplementary costing of charging NICs on salary-sacrificed pension contributions — £4.7bn in 2029–30 falling to £2.6bn in 2030–31; much of the first-year figure is a one-off timing effect from assumed switching between contribution arrangements, and the costing nets off £0.7bn in 2030–31 for employer rebalancing into ordinary contributions. Implementing legislation: the National Insurance Contributions (Employer Pensions Contributions) Act 2026 (Royal Assent April 2026), which sets the limit at £2,000 for a tax year and defers the operating mechanics, including treatment across employments, to regulations.
[2] HMRC policy paper and impact assessment accompanying the November 2025 Budget measure — c. 7.5 million employees contribute via salary sacrifice; c. 44% sacrifice more than £2,000 a year.
[3] HMRC-commissioned research on pension salary sacrifice (IFF Research, published 27 May 2025) — employer motivations and usage patterns, including usage of 32% among men vs 23% among women.
[4] Institute for Fiscal Studies: L. O’Brien & M. Oulton, “Assessing the government’s reform to the National Insurance treatment of salary sacrifice pension contributions”, IFS Report, May 2026 (and accompanying presentation, 13 May 2026) — distributional analysis based on ASHE 2021 uprated to 2029–30, with household effects from the Family Resources Survey and the TAXBEN model. The £25.9bn cost of the NICs exemption on employer contributions (2023–24) and the alternative uniform-subsidy proposal are from that report and Adam et al. (2023). The decile figures in ‘Who pays’ are digitised from its charts and are approximate; the imputation additionally assumes ~29 million UK employees, split evenly across deciles, and NI rates on the excess of 23% (deciles 1–7) and 17% (deciles 8–10).
[5] Rates and rules: employee NI 8% main / 2% additional, employer NI 15%, secondary threshold £5,000 (2025/26, HMRC); pension withdrawals taxed as income with a 25% tax-free lump sum, giving an effective exit-tax rate of about 15% for a basic-rate retiree (20% × 75%). Pension income does not attract NI. Salary sacrifice may not reduce pay below the National Minimum Wage (£12.21/hour for adults, 2025/26).
[6] Valuation: the base case values the Treasury’s proportional claim at market value — a claim on 15% of a risky portfolio is worth 15% of its current value, whatever the portfolio’s expected return, because expected outperformance over gilts is compensation for risk the Treasury bears alongside the saver. The gilt-discounted sensitivities (4.5% gilt rate; return gaps of 1–3% over 15–25 years) instead credit the government with risk tolerance across generations; whether that is legitimate is a live debate in public finance — compare Blanchard’s 2019 American Economic Association address on r versus g with Lucas and Zeldes’s argument for market valuation of public pension liabilities.
[7] The ‘relief as government spending’ view originates with Stanley Surrey (Pathways to Tax Reform, 1973), whose ‘tax expenditure’ concept underlies official costings. The ‘revenue forgone is not a cost’ view descends from Adam Smith (Wealth of Nations, 1776, Book II — private frugality builds national capital) and Milton Friedman (the burden of government is its spending, not its taxes); the transit losses of collection-and-redistribution are Arthur Okun’s ‘leaky bucket’ (Equality and Efficiency, 1975). The caveat that subsidised saving is not always a social gain is Keynes’s paradox of thrift (General Theory, 1936).
[8] All Husky figures: February 2025 platform extract, person-level records; analysis code available on request. No personal data appears in this paper. The 17.3% average NI rate on above-cap contributions is computed worker by worker from those records: 15% employer NI plus a contribution-weighted employee rate of 2.3%, most above-cap pounds sitting above the upper earnings limit.
[9] The optional remuneration arrangements (OpRA) rules in the Finance Act 2017 removed the tax and NI advantages of salary sacrifice for most benefits in kind from April 2017, with explicit carve-outs for employer pension contributions, pensions advice, cycle-to-work schemes and ultra-low-emission vehicles.
[10] The government’s fiscal mandate is assessed against the OBR’s rolling five-year forecast, and headroom against the fiscal rules has been the binding constraint in recent Budgets. Nothing in that framework attaches value to revenues arriving beyond the forecast horizon.
[11] L. Kaplow, ‘An Economic Analysis of Legal Transitions’, Harvard Law Review, 1986 (the classic case against grandfathering); D. Shaviro, When Rules Change: An Economic and Political Analysis of Transition Relief and Retroactivity, University of Chicago Press, 2000 (a more permissive treatment). E. Luttmer & A. Samwick, ‘The Welfare Cost of Perceived Policy Uncertainty: Evidence from Social Security’, American Economic Review, 2018 — individuals would forgo approximately 6% of benefits for certainty about future rules; their setting is entitlement to state benefits, not tax relief on private saving.
[12] R. Chetty, J. Friedman, S. Leth-Petersen, T. Nielsen & T. Olsen, ‘Active vs. Passive Decisions and Crowd-Out in Retirement Savings Accounts’, Quarterly Journal of Economics, 2014 — roughly 85% of savers respond passively to changes in the incentives for retirement saving; active responses are concentrated among higher-income, wealthier savers.
[13] The Mansion House Compact (July 2023) committed eleven DC pension providers to allocate at least 5% of default funds to unlisted equities by 2030. The Mansion House Accord (May 2025) extends it: seventeen of the largest workplace providers, with £252bn of assets in scope, pledged a minimum 10% of main default funds to private markets by 2030, at least half in UK private markets.
[14] Transition precedent: the introduction and successive cuts of the Lifetime Allowance (2006–2016) were each accompanied by formal HMRC protections (Primary, Enhanced, Fixed and Individual Protection); the Annual Allowance cuts of 2011 and 2014 were not, beyond carry-forward. The stock/flow distinction in the text follows correspondence with Laurence O’Brien (IFS), August 2026, whose point it is. On measured high-earner responses to UK pension tax limits, see IFS and British Medical Association evidence on the annual-allowance taper and NHS consultants’ working hours; more generally E. Saez, J. Slemrod & S. Giertz, ‘The Elasticity of Taxable Income’, Journal of Economic Literature, 2012.
[15] Small-firm estimate: authors’ calculations reweighting Husky per-user sacrifice distributions, in firm-size-band by SIC-section cells (those with fewer than 20 users pooled to band level), to private-sector employment from DBT, ‘Business Population Estimates 2025′, Table 5. Scenarios span small-firm salary-sacrifice usage of 5% to 26% (the HMRC economy-wide average); the central case takes half the national rate. Husky users’ above-cap intensity runs about a fifth above the implied national per-user average — platform selection that reweighting cannot remove.
[B1] Derivation assumptions: state pension equal to the personal allowance; 25% tax-free lump sum; the remaining 75% drawn at rate a; two tax bands (45% rate and the lump-sum allowance ignored). Saver illustration (markers approximate): £75,000 earner aged 41 with an existing pot of about £100,000, pay growth 3% a year, total pension contributions 10% of pay (own sacrifice plus employer) to age 68, pot projected at 4.5%, giving F ≈ £860,000 and retirement income ≈ £39,000 against higher-rate headroom H = £37,700; 6% drawdown; F/K ≈ 1.0–1.1 with thresholds frozen and ≈ 0.6 with thresholds rising 2% a year from 2028; σ√T of 0.4–0.6 (about 8–12% a year over 27 years, net of glidepath derisking), giving N(d₁) ≈ 0.6–0.7 frozen and 0.15–0.3 indexed. Corporation tax (2025/26): 25% main rate, 19% small-profits rate below £50,000, 26.5% marginal between. Inheritance tax on unused pots from April 2027 (Autumn Budget 2024). References: F. Black, ‘The pricing of commodity contracts’, Journal of Financial Economics, 1976; Lucas & Zeldes as in note [6].